The Path to NFL Linebacker Success
- WashU Sports Analytics
- Apr 19, 2018
- 5 min read
By Adam Dettelbach
Overview
The objective of this project was to determine what measurables for linebacker prospects are the greatest indicators of NFL success. Given the inconsistent availability of different metrics, the four measurables used were height, weight, 40-yard dash time, and 3 cone drill time. Additionally, I used three consistently available college statistics: solo tackles, assisted tackles, and tackles for loss. Statistics like pass deflections, sacks, and interceptions were not used because they were far too reliant on just two or three plays in an entire season.
As measures of professional success, I used Pro Football Reference’s AV (Adjusted Value) to measure AV/Game and AV/Year. These rewarded players for earning more playing time and for making more out of that playing time, while the former additionally avoided punishing injuries. I also ignored the rookie seasons if the player started fewer than six games to avoid having their averages dragged down by their rookie seasons.
I used data for every linebacker from the first and second round of every draft going back to the 2006 draft. The exceptions to this list were those that played primarily played 3-4 OLB in college or played it in the NFL, as well as those that played 4-3 DE in college/in the NFL. As a result, guys like Bruce Irvin, Von Miller, and Khalil Mack were excluded.
With these variables, I created a three-level structural equation model (SEM). On the top level are the four measurables, on the middle level are the three college tackle-related statistics, and on the bottom level are the two professional rating metrics. This enabled me to track the correlation between the college statistics and pro success, the measurables and the college statistics, and the measurables and pro success outside of their impacts on the statistics. In this case, the statistics were meant to correlate with run stopping success in the NFL, while the measureables were meant to correlate with both run and pass stopping success. Some of the results were truly surprising because of this.
The Model
(TFG = Tackles for loss/game · SoloG = Solo tackles/game · AssistsG = Assists/game)

Raw Data:
First, it is important to note that the results for AV/game and AV/year were similar but not identical. Fortunately, all relationships that were positive for one were positive for the other. The same cannot be said for solo tackles, assisted tackles, and tackles for loss per game, where positive relationships varied. In fact, no metric had a positive relationship with all three tackle stats, with 40-yard dash time and 3 cone drill time being the two measurables to have two positive relationships with tackle stats.
All three tackle stats had positive relationships (strengths varied) with the two professional metrics, though the strongest by far was assisted tackles, with values of .38 and .43 (stronger for AV/year).
The strongest relationship was unsurprisingly between height and weight. After the assisted tackles to pro metrics relationships, the next strongest was height directly to pro metrics, at 0.36 for each. 3 cone drill and 40 time also had decently strong direct relationships with pro success, as did tackles for loss.
What It All Means
To gauge how good of a linebacker you are getting in the first two rounds, your best bets are to look at their assisted tackles and their height. The former is going to help determine their run defense in the pros, while the latter is the best available indicator of their future pass defense prowess. On the other hand, height was an indicator of poor run stopping ability, so a lot depends on what a team prioritizes in their LB’s.
After those two, the 40-yard dash time and tackles for loss numbers serve as solid indicators, the latter for both run AND pass defense (though more so for pass defense than run).
On the flip side, 3 cone drill time, weight, and solo tackles are not as useful as predictors (though solo tackles do carry a bit of merit). The first two had mostly negative and negligible results, while the last simply gets overshadowed by the other two tackle statistics that came out more significant.
What it Means for This Past LB Class
Using the information gleaned from these regressions, I put together a model based on linear regression
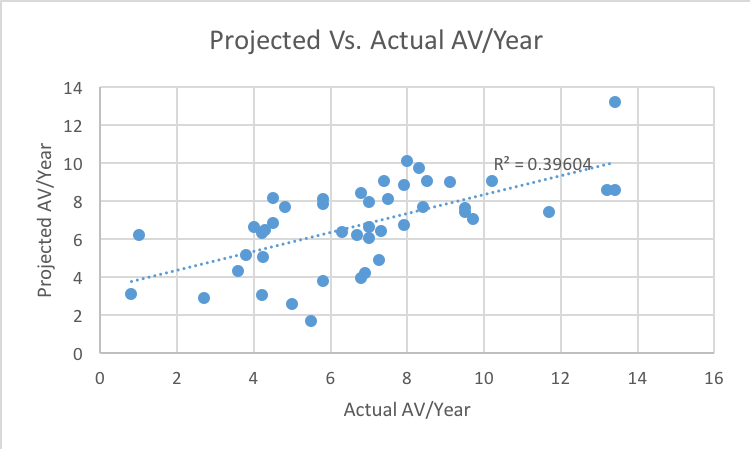
This shows the relation between projected professional success and actual outcome, with an R2 of .396 indicating a strong relationship between projections and reality. This strong model gave the following projections for the past LB class of qualifying players:

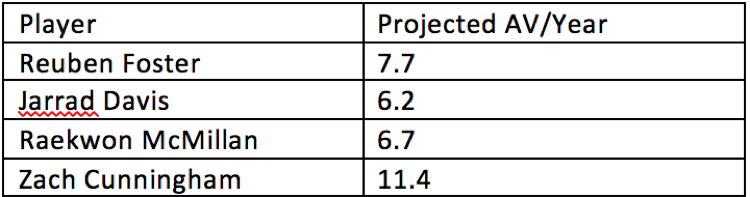
Surprisingly, all four players were given successful ratings, with Zach Cunningham edging out the other three by a wide margin.
So far, according to Pro Football Reference, Reuben Foster has been by far the best of the four with an AV/Game (he only played 10 games) of 0.5, which extrapolates to 8 per year, which is his exact projection. Zach Cunningham has been second with a very respectable AV/Game over his 13 starts of 0.38 (extrapolates to 6.2 over a full season). Jarrad Davis has had an AV/game of 0.5, like Foster, but in 14 games, however, on Pro Football Focus he has been the worst with a poor grade of 34.9 (83rd in the league at LB). Finally, Raekwon McMillan has spent the season on injured reserve due to a torn ACL in the preseason.
A Simplified Version
Using so many variables felt like over-fitting, so I decided to create a linear model using the three most statistically significant variables: height, assisted tackles, and tackles for loss. When the three of these were put into a regression, all three came out as statistically significant (on a .05 level), with an R2 of .323. This is the relationship the relationship between those projections and the actual values:

The average player with the negative projection in this model is Denzel Perryman, and he brings down the R2 substantially because of this. The projections for this past draft class are as follows
This preserves the order, but deflates the value of three players while further boosting the value of Zach Cunningham. In all, this model has (in a very limited sample size) been less accurate in estimating the success of this past year’s eligible LB’s than the more complex model. Thus, the more complex model wasn’t necessarily over-fitting, but may have actually been gleaning extra useful info about the LB class.
This Year’s Draft Class
As it turns out, only three potential 1st/2nd round picks at LB completed the 40-yard dash and the three cone drill either at the Scouting combine or at their respective pro days. As a result, most of the following predictions had to made using the simplified model.

Physical freak Tremaine Edmunds gets the best marks in this class, followed by Rashaan Evans and then Leighton Vander Esch. These players all get their high marks primarily because they are all at least 6’3, although Tremaine Edmunds also has the most assists per game of the entire class and ties for the most tackles for loss per game.
On the flip side, Jerome Baker had the lowest figures in all three metrics for the simplified model, earning him the lowest grade. Roquan Smith’s short stature coupled with his class-average other figures netted him the second lowest simplified model grade of the class. Save for Jerome Baker, none of the players are projected to bust entirely, although Smith is projected to not live up to his draft slot.
Summary
Using a path analysis in R I was able to conclude that height is the most important attribute for an NFL LB prospect when it comes to pass coverage, while assisted tackles are the most important statistic when it comes to predicting run stopping ability in the pros.
Two different models based on linear regression predicted that of the four 4-3 LBs/3-4 ILB’s taken in the first two rounds of the 2017 NFL draft, Zach Cunningham would be the most successful and Reuben Foster would be the second most successful, with Jarrad Davis the least successful. So far this prediction has been solid but not perfect in that all three have been successful, but to different degrees than predicted. The models gave mostly positive results for this year’s LB class, with the exception of Jerome Baker’s negative grade and Roquan Smith’s average grade.


Comments