Tennis Statistics That Matter
- WashU Sports Analytics
- Apr 30, 2018
- 2 min read
By Jack Briamonte and Rohan Gupta
Objective
This project was designed to analyze the relationship between player ranking and various different player statistics among the top ranked tennis players during the year 2017. We gathered all available information from the ATP World Tour website (http://www.atpworldtour.com/en/stats) and ran regressions between individual player statistics and their respective rankings. We believe that while there will be stronger correlations between certain statistics and player performance, certain player statistics will have a stronger correlation with ranking. Because currently there is no “best measure,” for predicting a player’s success, we think that our regressions which measure the correlation between all ATP measured statistics and current ranking, will find a few useful statistics with an R2 value greater than 0.2, indicating which statistics are most useful for measuring player success and which statistics do not give an accurate estimate, those with an R2 value less than 0.2. Since player ability cannot simply be measured by one statistic, we anticipate that an R2 value greater than 0.2 is strong enough to suggest that there is a strong correlation between the statistic and player ranking. In addition, we expect the regressions to have widely different relationships, but we are not concerned with how exactly different statistics relate to actual performance, but rather, whether or not there is any correlation at all.
Data
We calculated regressions based on over 30 statistics for 81 top tennis players.
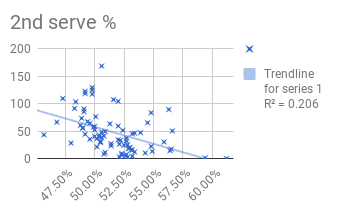
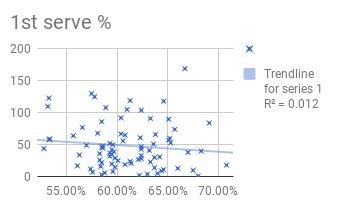
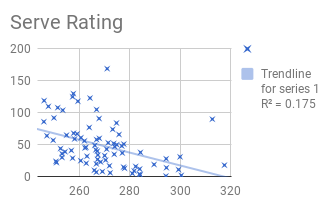
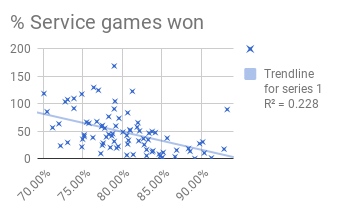
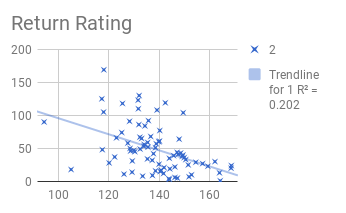
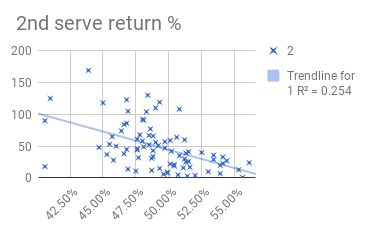
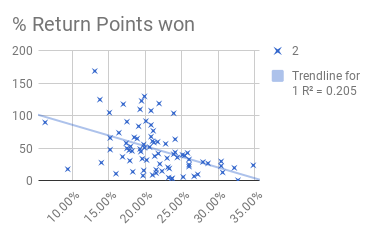
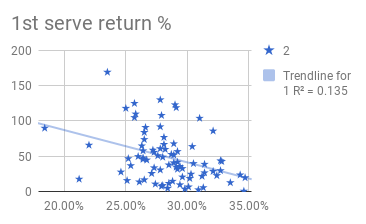
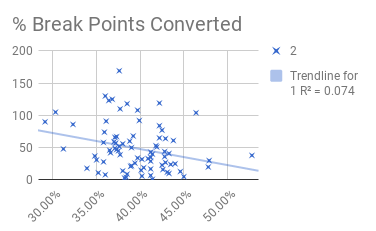
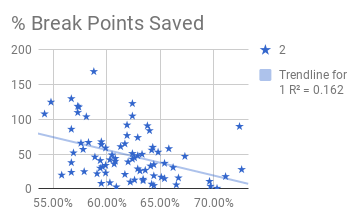
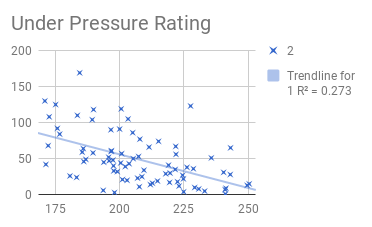
All graphs indicate Single Ranking (as of Jan. 2018) on the y-axis and the graph title for each regression describes the x-axis
Serve rating and return rating were calculated by the ATP using their own metric; we included this in our regressions measure whether taking into account other factors like serve location, speed, spin, etc., as ATP did, is correlated to a player’s success
The following are some of the regressions from our analysis:
Total points won was calculated by multiplying respective winning percentages by 100, adding aces, subtracting double faults, and summing the total points won. (i.e. out of 200 possible points in a given match, 100 serve, 100 return, how many would we expect each player to win)
Conclusions
Based on our regressions, we believe that there are a few useful statistics that should be used to measure a players ability, and a few that should not be used to measure objective ability, however combining multiple factors as done in “Total Points Won” results in a stronger estimation of player success. The following statistics appear useful for predicting player success
2nd Serve Win %, % Service Games Won, 2nd Serve Return Win %, Under Pressure Rating, and Total Points Won
This information suggests that when players who play well under pressure – Under Pressure Rating, and Second Serve Win% – and win the easy points – Second Serve Win %, and % Service Games Won – in a given year, they are more likely to succeed.
Based on our analysis we believe, that players like Rafael Nadal, Stan Wawrinka, Novak Djokovic, Diego Schwartzman, Roger Federer, and John Isner will outperform expectations in 2018 – they will end the year ranked higher than they started 2018, or, in the case of the best players, they will finish at least in the top 5. These players all rank top 5 in at least 2 categories of statistics that we deemed important in this analysis.














Comments